Sample #1 is a humor column copyedited for proofreading. Sample #2 is an excerpt from an instructional article on Software development, comprehensively edited for clarity, content, narrative structure, ease of readability, and proofreading.
Sample #1 Edited:
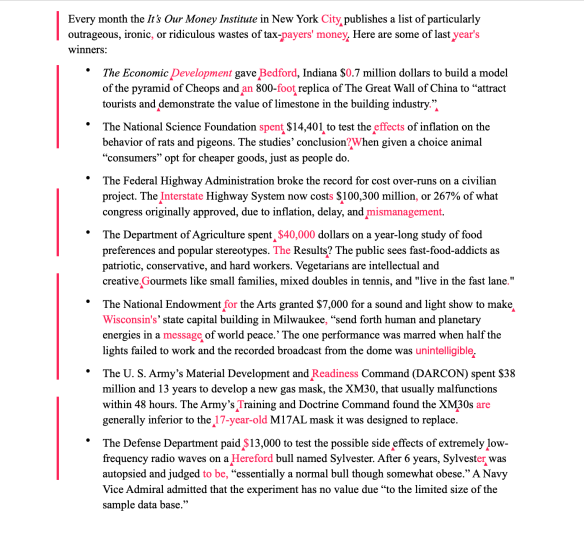
Every month, the It’s Our Money Institute in New York City publishes a list of particularly outrageous, ironic, or ridiculous wastes of tax-payers’ money. Here are some of last year’s winners:
- The Economic Development gave Bedford, Indiana $0.7 million dollars to build a model of the pyramid of Cheops and an 800-foot replica of The Great Wall of China to “attract tourists and demonstrate the value of limestone in the building industry.”
- The National Science Foundation spent $14,401 to test the effects of inflation on the behavior of rats and pigeons. The studies’ conclusion? When given a choice animal “consumers” opt for cheaper goods, just as people do.
- The Federal Highway Administration broke the record for cost over-runs on a civilian project. The Interstate Highway System now costs $100,300 million, or 267% of what congress originally approved, due to inflation, delay, and mismanagement.
- The Department of Agriculture spent $40,000 dollars on a year-long study of food preferences and popular stereotypes. The results? The public sees fast-food-addicts as patriotic, conservative, and hard workers. Vegetarians are intellectual and creative. Gourmets like small families, mixed doubles in tennis, and “live in the fast lane.”
- The National Endowment for the Arts granted $7,000 for a sound and light show to make Wisconsin’s state capital building in Milwaukee, “send forth human and planetary energies in a message of world peace.” The one performance was marred when half the lights failed to work and the recorded broadcast from the dome was unintelligible.
- The U.S. Army’s Material Development and Readiness Command (DARCON) spent $38 million and 13 years to develop a new gas mask, the XM30, that usually malfunctions within 48 hours. The Army’s training and Doctrine Command found the XM30s are generally inferior to the 17-year-old M17AL mask it was designed to replace.
- The Defense Department paid $13,000 to test the possible side effects of extremely low- frequency radio waves on a Hereford bull named Sylvester. After six years, Sylvester was autopsied and judged to be, “essentially a normal bull though somewhat obese.” A Navy Vice Admiral admitted that the experiment had no value due to “the limited size of the sample data base.”
Sample #1 Original:
Sample #2 Edited:
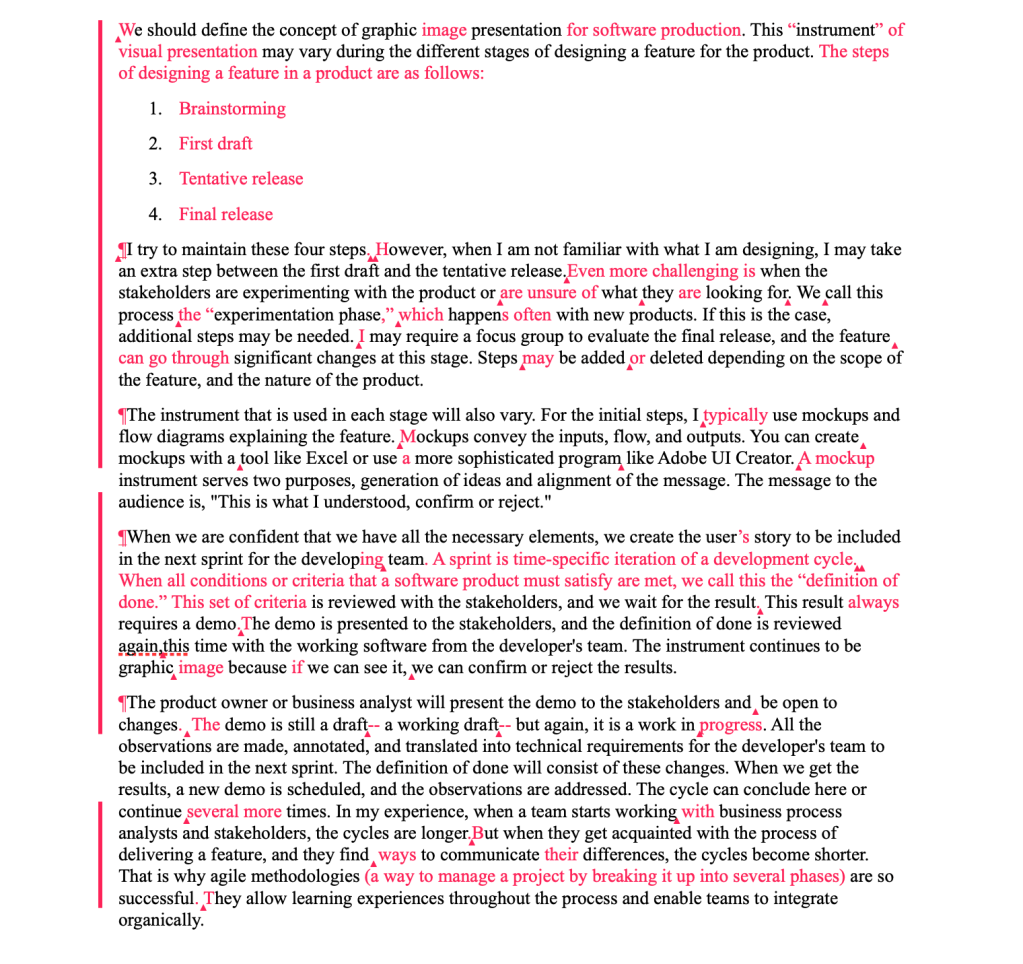
We should define the concept of graphic image presentation for software production. This “instrument” of visual presentation may vary during the distinct stages of designing a feature for the product. The steps of designing a feature in a product are as follows:
- Brainstorming
- First draft
- Tentative release
- Final release
I try to maintain these four steps. However, when I am not familiar with what I am designing, I may take an extra step between the first draft and the tentative release. Even more challenging is when the stakeholders are experimenting with the product or are unsure of what they are looking for. We can call this process the “experimentation phase,” which happens often with new products. In this case, additional steps may be needed. I may require a focus group to evaluate the final release, and the feature can go through significant changes at this stage. Steps may be added or deleted depending on the scope of the feature and the nature of the product.
The instrument that is used in each stage will also vary. For the initial steps, I typically use mockups and flow diagrams explaining the feature. Mockups convey the inputs, flow, and outputs. You can create mockups with a tool like Excel or use a more sophisticated program like Adobe UI Creator. A mockup instrument serves two purposes: generation of ideas, and alignment of the message. The message to the audience is, “This is what I understood, confirm or reject.”
When we are confident that we have all the necessary elements, we create the user’s story to be included in the next sprint for the developing team. A “sprint” is time-specific iteration of a development cycle. When all conditions or criteria that a software product must satisfy are met, we call this the “definition of done.” This set of criteria is reviewed with the stakeholders, and we wait for the result. This result always requires a demo. The demo is presented to the stakeholders, and the definition of done is reviewed again, this time with the working software from the developer’s team. The instrument continues to be a graphic image because if we can see it, we can confirm or reject the results.
The product owner or business analyst will present the demo to the stakeholders and be open to changes. This demo is still a draft — a working draft — but again, it is a work in progress. All the observations are made, annotated, and translated into technical requirements for the developer’s team to be included in the next sprint. The definition of done will consist of these changes. When we get the results, a new demo is scheduled, and the observations are addressed. The cycle can conclude here or continue several more times. In my experience, when a team starts working with business process analysts and stakeholders, the cycles are longer. But when they get acquainted with the process of delivering a feature, and they find ways to communicate their differences, the cycles become shorter. That is why agile methodologies (a way to manage a project by breaking it up into several phases) are so successful. They allow learning experiences throughout the process and enable teams to integrate organically.
Sample #2 Original:


You must be logged in to post a comment.